고정 헤더 영역
상세 컨텐츠
본문
A. 판다스 API를 이용한 시각화 - 수치형 변수
1. 전체 수치변수에 대한 히스토그램
df.hist(bins=100, figsize=(12,8))
plt.show()
2. line
year_month = df["연도월"].value_counts().sort_index(ascending=True)
year_month.plot()
- 선 추가
day_cnt = df["확진일"].value_counts().sort_index()
day_cnt.plot(title="일자별 확진수", figsize=(10, 3))
plt.axhline(1500, c="r", lw = 0.5, ls = "--") #1500에서, c: 색깔, lw: 선굵기, ls:선스타일

3. area
year_month.area()
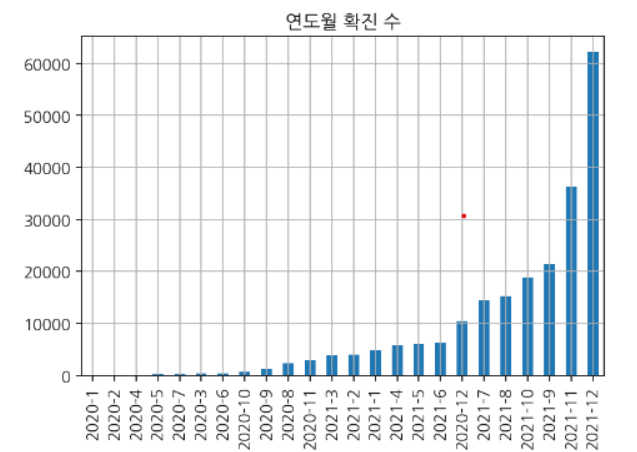
4. bar
year_month.plot(kind="bar")
- grid와 title 기능의 추가
year_month.plot(kind="bar", grid=True, title="연도월 확진자수")
- rot와 title 기능 추가
weekday_count.plot(kind="bar", rot=0, title = "요일 별 확진 수", figsize = (10, 3))
B. 판다스 API를 이용한 시각화 - 범주형 변수
1. 한 개 변수에 대한 시각화
gu_count = df["거주구"].value_counts()
gu_count.plot(kind="bar", rot = 70)

2. 2개 변수에 대한 시각화
ym = pd.crosstab(index=df["연도"], columns=df["월"])
ym
barplor으로 시각화하기
ym.plot(kind="bar")
ym = pd.crosstab(index=df["연도"], columns=df["월"])
ym

barplot으로 시각화하기
ym.plot(kind="bar")

'멋사 AISCOOL 7기 Python > INPUT' 카테고리의 다른 글
| [데이터 집계] pd.crosstab, pivot table, group by (0) | 2022.10.28 |
|---|---|
| 빈 날짜 채우기, 누적 합 구하기 (0) | 2022.10.28 |
| [PANDAS] 전처리 & EDA 총정리 (0) | 2022.10.27 |
| [시각화] Plotly (0) | 2022.10.27 |
| [크롤링 & EDA] 메인 및 상세 페이지 수집 함수 만들기: 서울특별시 다산콜센터의 주요 민원 (0) | 2022.10.26 |


