고정 헤더 영역
상세 컨텐츠
본문 제목
[머신러닝] Titanic 데이터를 사용한 분류: Decision Tree, Binary Encoding, Entropy
본문
⛴️ DATA: Titanic
• https://www.kaggle.com/competitions/titanic
- 경진대회 파일이며 train, test 데이터가 나눠서 주어진다.
- test 파일에는 survived 컬럼이 존재하지 않는다.
train = pd.read_csv("data/Titanic/train.csv", index_col="PassengerId")
print(train.shape) #(891, 11)
test = pd.read_csv("data/Titanic/test.csv", index_col="PassengerId")
print(test.shape) #(418, 10)
<class 'pandas.core.frame.DataFrame'>
Int64Index: 891 entries, 1 to 891
Data columns (total 11 columns):
 #   Column    Non-Null Count  Dtype
---  ------    --------------  -----
 0   Survived  891 non-null    int64
 1   Pclass    891 non-null    int64
 2   Name      891 non-null    object
 3   Sex       891 non-null    object
 4   Age       714 non-null    float64
 5   SibSp     891 non-null    int64
 6   Parch     891 non-null    int64
 7   Ticket    891 non-null    object
 8   Fare      891 non-null    float64
 9   Cabin     204 non-null    object
 10  Embarked  889 non-null    object
dtypes: float64(2), int64(4), object(5)
memory usage: 83.5+ KB
# 결측치
fig, axes = plt.subplot(nrows=2, ncols=2, figsize=(12,8))
sns.heatmap(train.isnull(), cmap="gray", ax = axes[0])
sns.heatmap(test.isnull(), cmap="gray", ax = axes[1])
sns.barplot(data = train.isnull(), ax = axes[1, 0], errorbar=None)
sns.barplot(data = test.isnull(), ax = axes[1, 1], errorbar=None)

✅ Baseline: Decision Tree + binary encoding + 엔트로피
1️⃣ feature engineering: Binary Encoding
label 값의 빈도수를 성별에 따라 비교해봤을 때 차이가 있음이 보인다. 따라서 성별에 따라 인코딩을 한다.
어떻게 보면 label encoding 혹은 ordinal encoding이라 볼 수 있다( True/False는 0,1로 표시된다)
train["Survived"].value_counts()

>>> 0    549
	1    342

sns.countplot(data = train, x="Survived", hue="Sex")
# feature engineering
# binary encoding
train["Gender"] = train["Sex"] == "female"
test["Gender"] = test["Sex"] == "female"
# 머신러닝 모델은 boolean값은 수치형 데이터로 인식함
display(train["Gender"].head(2))
display(test["Gender"].head(2))
PassengerId
1 False
2 True
Name: Gender, dtype: bool
PassengerId
892 False
893 True
Name: Gender, dtype: bool
2️⃣ 모델링 준비
# 정답이자 예측해야 할 값
label_name = "Survived"

# 학습, 예측에 사용할 컬럼
feature_names = ['Pclass', 'Age', 'SibSp', 'Parch', 'Fare', 'Gender']
# 결측치는 0으로 대체한다
X_train = train[feature_names].fillna(0)
X_test = test[feature_names].fillna(0)
y_train = train[label_name]- test파일에 survived 컬럼이 존재하지 않는다. 따라서 y_test를 만들 수 없다.
- 이럴 경우 cross validation(교차검증) 혹은 하이퍼파라미터를 통해 찾아낸 best estimator를 통해 미리 스코어를 확인하고, kaggle에 제출하여 점수를 확인한다.
3️⃣모델링
from sklearn.tree import DecisionTreeClassifier

model = DecisionTreeClassifier(criterion = "entropy", random_state=42)
model.fit(X_train, y_train)
y_predict = model.predict(X_test)
✏️ 3.1 Entropy
- How to Determine the Best Split

- Gini Index
- Entropy
- Misclassificaion error

- 정보 이론에서 확률 변수의 엔트로피는 변수의 가능한 결과에 고유한 “정보”, “놀라움” 또는 “불확실성”의 평균 수준이다.
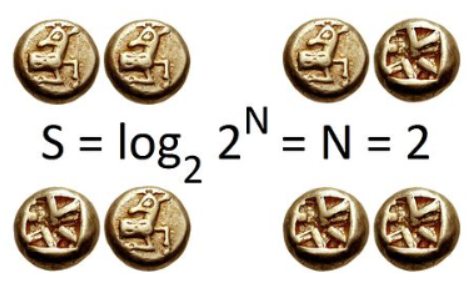
- 2번의 공정한 동전 던지기의 경우 비트 단위의 정보 엔트로피는 가능한 결과수의 밑이 2인 로그이다. 2개의 동전으로 4개의 가능한 결과와 2비트의 엔트로피가 있다. 이를 2비트의 엔트로피라고 한다.일반적으로 정보 엔트로피는 가능한 모든 결과를 고려할 때 이벤트가 전달하는 평균 정보량이다.
- 클래스는 분류개수에 따라서 달라진다. 예를 들어 당뇨병의 여부는 2진분류로 2개의 클래스가, 쇼핑카테고리가 19개라면 19개로 분류되어 10개의 클래스가 있다고 볼 수 있다.
- 클래스를 예측할 때는 T/F로 예측하기도 하지만 멀티클래스일때는 특정 클래스의 확률을 예측하기도 한다.
- 값이 1에 가까워질 수록 불확실성이 높아진다.
-
- ((1/2)*np.log2(1/2) + (1/2)*np.log2(1/2)) = 1.0
-
- 값이 0에 가까울 수록 불확실성이 낮아지며, 확실하게 구분된다.
-
- ((1/2)*np.log2(2/2) + (0/2)*np.log2(1/2)) = - 0.0
-
- 시행의 결과를 식별하여 전달되는 정보의 예상(즉, 평균)양을 측정한다.
➕로그
-
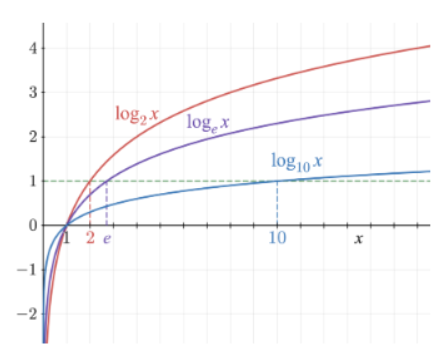
- 지수함수의 역함수이다. 어떤 수를 나타내기 위해 고정된 밑을 몇번 곱하여야 하는지를 나타낸다고 볼 수 있다.
- x가 1일때 y가 0이다
- 기울기가 완만하게 증가한다.
- x는 0보다 큰 값만 가진다.
- x가 1보다 작을 때 y값은 마이너스 무한대로 수렵한다
✏️ 3.2 지니계수 vs 엔트로피
- 이 둘을 사용하는 목적?
- 불순도를 파악하기 위해서, 분류를 했을 때 분류의 품질을 평가하고 싶을 때 사용한다.
- 분류를 했을 때 t/f로 완전히 나눠지지 않았는데, 이때 값이 얼마나 섞여있는지 수치로 확인하기 위해서
- 0에 가까울 수록 다른 값이 섞여있지 않은 상태이다.
- 지니계수보다 더 엄격하게 판단하고자 할 때 엔트로피를 사용한다.
- 트리를 보게 되면 트리 아래로 갈수록 0에 가까워지며, 지니 불순도가 엔트로피가 0이되면 분할을 멈춘다.
- 이 개념은 제출 전 모델이 얼마나 잘 분류되었는지를 판단하고 확인할 때 참고할 수 있으며, 함께 참고해볼 수 있는 것이 피처 중요도, 교차 검증 값이라 볼 수 있다.
- max_depth와는 무관하다.
4️⃣시각화 및 엔트로피 계산
from sklearn.tree import plot_tree

plt.figure(figsize=(12,6))
plot_tree(model,
          max_depth=4,
          fontsize=12,
          filled=True,
          feature_names = feature_names)
plt.show()

# 루트노드 엔트로피 구하기
-((549/891)*np.log2(549/891) + (342/891)*np.log2(342/891))
>>> 0.9607079018756469
# 지니계수 구하기
1 - (549/891) ** 2  - (342/891)**2
>>> 0.4730129578614428
sns.barplot(x = model.feature_importances_, y=model.feature_names_in_)


